 Download
CoinAnk: Your Advanced Cryptocurrency Analysis Platform
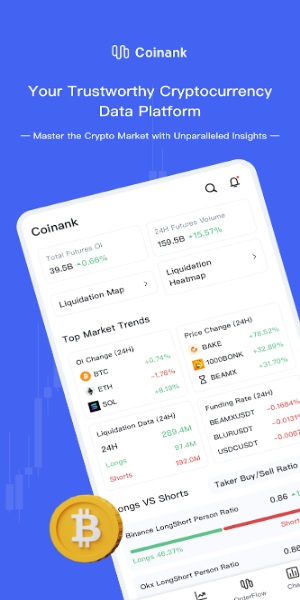
CoinAnk is a sophisticated cryptocurrency analysis platform designed for traders and investors seeking in-depth market insights. We focus on order flow and derivatives data to empower informed decision-making in the volatile crypto market.

Real-time Data Access via the CoinAnk App:
- Real-time contract position statistics from leading global exchanges, covering BTC, ETH, BNB, ADA, XRP, DOGE, LTC, BCH, LINK, UNI, MATIC, FTM, EOS, and a wide range of altcoins.
- Real-time liquidation statistics for each exchange, intuitively displayed via charts and leaderboards, tracking both long and short liquidations.
- Real-time aggregation of overall active trading volume, long-short ratio, long-short position ratio, and the long-to-short ratio of significant accounts and positions.
- Comparison of real-time and predicted funding rates for each exchange (USDT and USD units), including access to historical funding rate data.
- Grey-scale data analysis.

CoinAnk: A Free Mobile Application for Enhanced Trading:
- Access real-time cryptocurrency market data and create a personalized watchlist of your favorite cryptocurrencies.
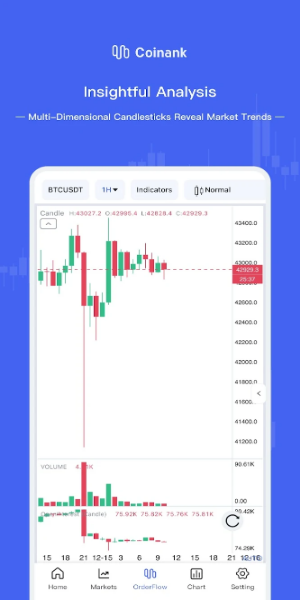
- View real-time K-line charts, comparing contract data across various dimensions. Utilize K-line charts to generate technical indicators for different timeframes, revealing valuable market trends.
- Set custom alerts for price movements, short-term volatility, funding rates, large liquidations, long-short ratios, and on-chain large-value wallet transfers. Receive notifications when your alert thresholds are met.
- Manage your portfolio effectively with our robust portfolio tracker.
- Utilize numerous technical indicators for data visualization and analysis, including AHR999 fixed investment sub-monitoring indicators, top escape indicators, Pi cycle top indicators, Poor's multiple indicators, two-year MA multiplier, BTC market value ratio, BTC rainbow chart, and hundreds more chart and on-chain data statistics.
Highlights:
- Floating widget functionality.
- Multi-chart K-line viewing mode, enabling real-time display of various currency K-line charts on a single interface.
- Order flow, footprint, liquidation chart, and liquidation heat map visualizations.
Key App Features:
- Intuitive Order Flow Visualizations: CoinAnk provides detailed visual representations of order flow across major cryptocurrency exchanges. These visualizations highlight the concentration and changes in buy and sell orders, offering valuable insights into market sentiment.
- Comprehensive Derivatives Data Dashboard: Access comprehensive dashboards displaying derivatives data from leading exchanges, including futures, options, and other derivative products. Monitor trends, volatility, and trading volumes within the derivatives market.
- Advanced K-Line Charts with Technical Analysis: Utilize advanced K-line charts equipped with professional technical analysis tools and indicators. Clearly visualize price movements, support and resistance levels, and trend patterns.
- Specialized Derivatives Data Indicators: Beyond standard technical indicators, we offer specialized indicators for analyzing derivatives data. Identify potential opportunities and risks, such as overbought/oversold conditions, spot/derivative price divergence, and shifts in market sentiment.
- Professional-Grade Order Flow Visuals: Gain a detailed understanding of buying and selling pressure with our professional order flow visuals. Real-time visualization of order flow data helps you observe liquidity shifts and anticipate potential price movements.
- Highly Customizable Interface: Personalize your trading experience with CoinAnk's customizable interface. Tailor the layout, charts, and data displays to suit your individual preferences and trading style.